
Forex Trading Strategies Explained: Scalping, Day Trading, Trends and Ranges
Understand scalping, day trading, swing trading, trends, ranges, breakouts and grids before matching a strategy to the market in front of you.
Do not start by asking which strategy has the highest win rate
The question I hear most from newer traders is: “Should I scalp, day trade or follow trends?” Two details have to come first: how long can you hold a trade, and what is the market doing now? A trader with two free hours in the evening should not copy a method that needs several days of monitoring. A range trader should not keep selling after price has established a trend.
A strategy is not just an indicator. It is a combination of holding period, market condition, entry trigger, invalidation and risk. Let us unpack those pieces before building a market-condition decision guide.
First choose the holding style
01 | Scalping: many small, fast decisions
A scalper may hold for seconds or minutes and target only a few pips. Suppose EUR/USD has a one-pip spread and the target is four pips. Add half a pip of slippage and 37.5% of the gross target has already gone. Scalping is not automatically safer because trades are short; its risks are high frequency, cost and execution error. It suits liquid hours and traders who can stay fully focused.
02 | Day trading: open and close on the same day
Day trading means avoiding overnight exposure, not trading every few minutes. A trader might wait for London to break the Asian-session high, then enter only if the retest holds. The benefit is a defined working window. The trap is feeling that every day must contain a trade.
03 | Swing trading: wait several days for a fuller move
Swing traders normally work from four-hour or daily charts. If EUR/USD is in a daily uptrend and pulls back to a former breakout level, a swing trader may use a wider stop and wait for the next leg. A wider stop does not justify a larger cash loss: position size should fall as stop distance grows.
Scalping, day trading and swing trading describe time horizon. Trend, range and breakout describe the logic used to enter. You can follow a trend on a 15-minute chart or on a daily chart.
Now understand what the common strategies are trying to capture
01 | Trend following
A trend trader does not buy simply because price has risen. The trader first looks for a sequence of higher highs and higher lows, then waits for a pullback or continuation. If EUR/USD rises from 1.0800 to 1.0950, pulls back to 1.0900 and holds above the prior structural low, the trend case remains intact. A sustained break below that low invalidates it.
02 | Range trading
Range trading works when price repeatedly rejects two boundaries. If EUR/USD has found buyers near 1.0800 and sellers near 1.0860 several times, a trader may buy a confirmed rejection near the lower edge and exit near the middle or upper edge. Once price closes and holds outside the range, the old boundary trade must stop.
03 | Breakout trading
A breakout aims to capture the move from balance to expansion. A spike to 1.0870 followed by an immediate return to 1.0845 is not convincing. A close above 1.0860 followed by a retest that holds provides better evidence. The point is not to predict every breakout; it is to define what confirmation and failure look like before entering.
04 | Grid trading
A grid places orders at several levels to harvest back-and-forth movement. It can look smooth in a range, then accumulate losses when price trends in one direction. Every grid needs a maximum number of levels, maximum total exposure and an account-level stop. Without those limits, it becomes unlimited averaging.
If you can already see the trend, use Pocket Forex's quick charts and market tools to confirm levels and plan the entry, stop and exit. If the chart still looks ambiguous, its AI chart analysis, AI signals and grid strategies can provide a second opinion and reduce guesswork. Treat every output as supporting evidence, not permission to ignore position size or invalidation.
What is a market-condition decision guide?
It is simply a “diagnose first, choose second” routine. Before opening an indicator, ask: Is there a clear direction? Are repeated boundaries visible? Is volatility contracting or expanding? Is a major rate, inflation or employment release close? The answers determine whether trend, range, breakout or waiting is more appropriate.
One EUR/USD day, three different decisions
EUR/USD spends the Asian session between 1.0830 and 1.0850. There is little room, so the sensible decision may be to watch. London then closes above 1.0850 at 1.0862, retests 1.0852 and rises again. The market has shifted from range to breakout continuation, so repeatedly selling the old upper boundary no longer makes sense.
If US employment data is due minutes later, the clean-looking structure still may not be worth trading because spreads and slippage can jump. Experienced traders do not always have a better prediction; they are better at recognising when evidence or execution is not good enough.
ATR helps set distance, not direction
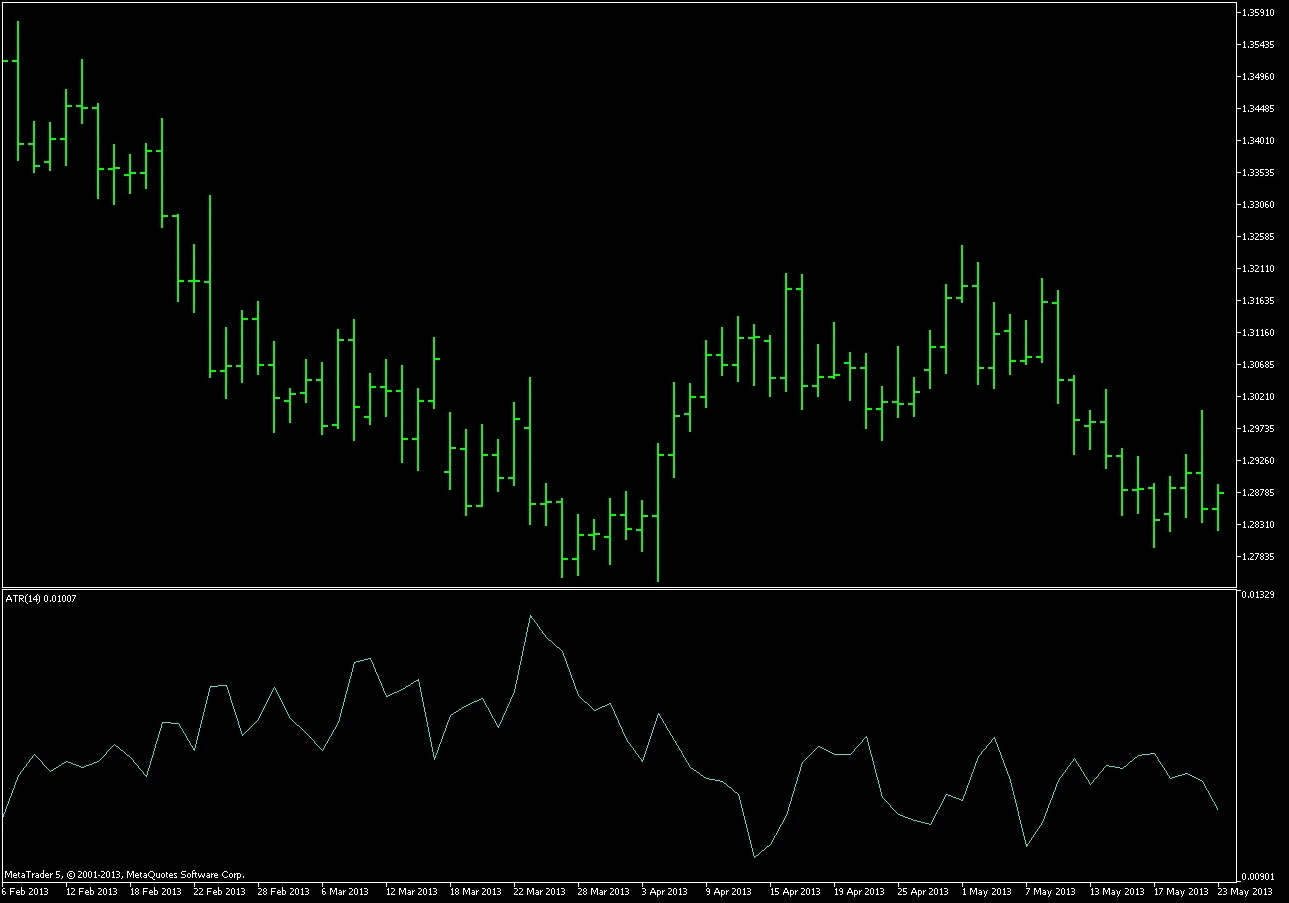
Average True Range measures how far price has recently moved. If ATR(14) rises from 45 to 80 pips, a fixed 20-pip stop is more likely to be hit by ordinary movement. The stop may need more room, but the lot size must fall so the cash risk stays constant. ATR never tells you whether the next move is up or down.
Win rate is not enough
An 80% win rate can still lose money if the average win is $20 and the average loss is $100. Use net expectancy: win rate × average net win − loss rate × average net loss, after spread, commission, financing and slippage. Scalping is especially sensitive to execution cost; swing trading is more exposed to financing and event gaps.
Six items to write before entering
- Holding style and expected duration
- Trend, range, breakout or event-risk condition
- Entry trigger and exact invalidation
- Stop distance, cash risk and lot size
- Spread, commission, financing and slippage
- Maximum trades, daily loss and stop-trading rule
When to pause instead of changing more settings
Pause when the market condition disappears, live costs exceed the test, the contract specification changes or losses move outside the validated range. Do not change the indicator, timeframe and stop after every losing trade. Review a fixed sample and separate a bad environment, bad execution and a broken premise.
Sources and image credit
- CFTC forex risk advisory: https://www.cftc.gov/LearnAndProtect/AdvisoriesAndArticles/CustomerAdvisory_MustKnowForex.html
- Investor.gov forex bulletin: https://www.investor.gov/introduction-investing/general-resources/news-alerts/alerts-bulletins/foreign
- ATR chart: Wikimedia Commons, CC BY-SA 3.0: https://commons.wikimedia.org/wiki/File:ATR_Indicator_Chart.png