
Candlestick Patterns: The 12 That Actually Show Up in Forex
Structure first, pattern second, risk last. Get the order wrong and the pattern is just noise.
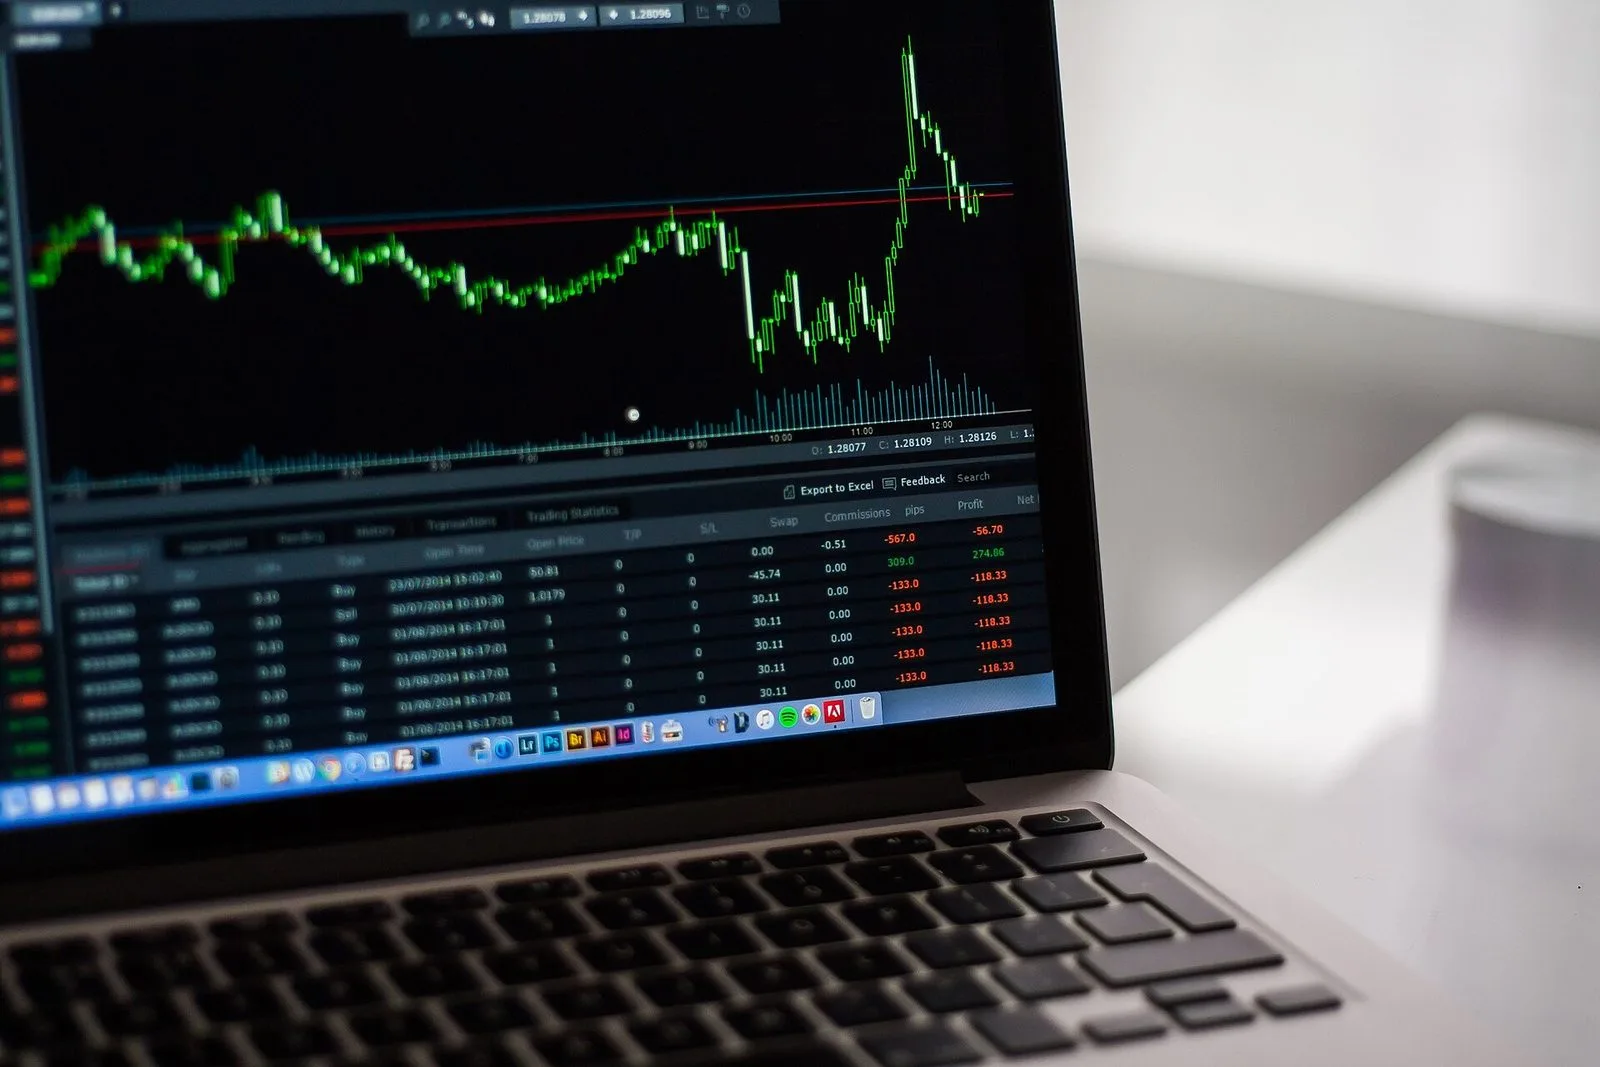
Candlestick patterns are the most-covered topic in beginner forex material and the most over-sold. The honest version: a pattern on its own carries very little information. Location and risk control decide whether it means anything.
Location before pattern
The same hammer at a key support level after a prolonged decline, and the same hammer in the middle of a range, mean entirely different things. A pattern describes how buyers and sellers fought inside one candle; it says nothing about whether this is a level worth trading.
So the correct order is: establish structure (trend, range, key level), then read the pattern (reversal or continuation), then define risk (where the stop goes, how much you can lose).
Twelve patterns in three groups
Group one: single-candle hesitation (weakest signal, requires location)
- Doji: open and close nearly equal. It means buyers and sellers cancelled out; it only matters at the end of a trend
- Hammer: long lower wick, small body, at the end of a decline. The longer the wick, the stronger the buying below
- Hanging man: same shape as a hammer, but at the end of an advance, with the opposite meaning
- Shooting star: long upper wick, small body, at the end of an advance
Group two: two-candle confirmation (needs the prior candle's direction)
- Bullish engulfing: a bullish body fully covers the previous bearish body, at the end of a decline
- Bearish engulfing: a bearish body covers the previous bullish body, at the end of an advance
- Harami: the second candle sits entirely inside the first body, signalling momentum fading
- Tweezers top or bottom: two candles with near-identical highs or lows, showing a level repeatedly rejected
Group three: three-candle structure (strongest signal, rarest)
- Morning star: large bearish candle, small body, large bullish candle, at the end of a decline
- Evening star: large bullish candle, small body, large bearish candle, at the end of an advance
- Three white soldiers: three consecutive bullish candles with rising bodies
- Three black crows: three consecutive bearish candles with rising bodies
Invalidation conditions matter more than the pattern
Knowing the shape is step one. Knowing when it does not count is the part you can trade:
- Doji: mid-trend rather than at an extreme, it is consolidation, not reversal
- Hammer / hanging man: if the wick is less than twice the body, the rejection is too weak
- Shooting star: if the upper wick never reached the prior resistance, it is just a long wick
- Engulfing: if the second body only covers half of the first, it is not an engulfing
- Harami: a tiny second candle in the middle of a range is usually just a liquidity vacuum
- Tweezers: if the two highs differ by more than 3–5 pips, it is not the same level being rejected
- Morning / evening star: if the small middle candle's range stays inside the neighbouring bodies, the setup is not valid
- Three soldiers / three crows: any long wick among the three means the move already met resistance
The common thread: strength comes from how forcefully a level was rejected or accepted, not from how closely the shape matches a textbook. Wick length, whether the body truly covered, and whether the location was a real level decide the outcome far more than resemblance.
Frequency: the stronger the pattern, the rarer it is
Rough daily-timeframe frequencies (they vary a lot by instrument, so treat these as orders of magnitude): doji is the most common, appearing almost every week; hammers and shooting stars next; engulfing patterns around one or two a week; harami rarer; morning and evening stars on a daily chart may appear only once or twice a month.
That ranking has a direct implication: if you can find a textbook pattern every day, you are looking at noise. Frequency is itself a filter.
Why patterns fail
Three reasons, in order of importance:
One: wrong location. A pattern describes internal candle structure, not the market context. An engulfing in the middle of a range is very likely noise.
Two: wrong timeframe. A "morning star" on the one-minute chart is a minor blip on the four-hour. The smaller the timeframe, the more patterns you find and the more noise you carry.
Three: no liquidity behind it. FX has no centralised volume, but session liquidity is a usable proxy: a pattern in the Asian session is generally less reliable than one in the London–New York overlap.
Fake breakouts: the most common trap
Breakout patterns — triangles, flags, rectangles — most typically fail by faking: price pierces the level, triggers a batch of stops, then snaps back inside the range.
Three conditions separate real from fake: the close is beyond the level (not just the wick), the retest holds, and volatility expands on the break. If all three are not met, treat it as fake.
How to use them: three-point confirmation
- Location: the pattern sits at key support or resistance, a prior high or low, or a cluster of moving averages
- Structure: the pattern's direction agrees with the prevailing trend or the range boundary
- Risk: the stop goes where the pattern invalidates (below the hammer, under the engulfing low), with risk-reward of at least 1:2
All three, or no trade. A pattern without location and without a defined risk is, over time, guaranteed negative expectancy.
FAQ
How many patterns do I need? Twelve is enough. Location and risk control drive the result, not the size of your pattern vocabulary.
How do timeframes combine? Higher timeframe for direction, lower for entry: four-hour for trend, one-hour for the pattern. Inverted — one-hour for direction, one-minute for patterns — noise eats the edge.