
AI Chart Reading: What It Sees, What It Misses, and How to Use It
It is good at describing what is on the chart. It is not good at telling you what happens next. Separate the two and it becomes useful.
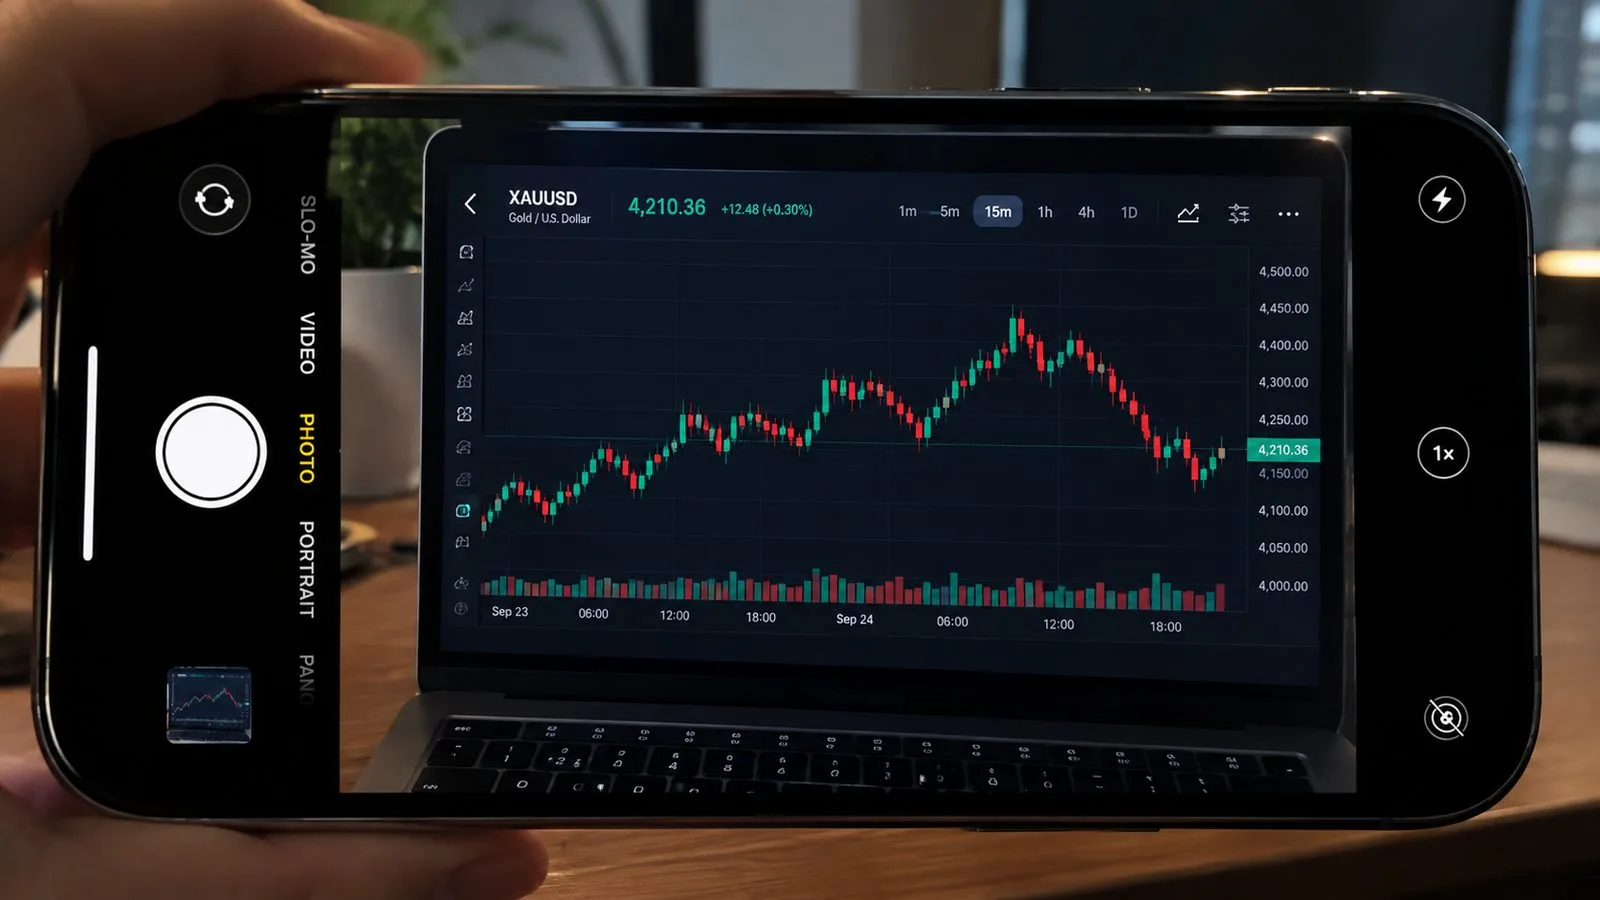
Since 2023, "screenshot a chart and ask the AI where price goes next" has become a popular habit. It can do more than you might expect, and less than the marketing suggests.
What AI chart reading does well
- Structure identification: trendlines, range boundaries, prior highs and lows, obvious support and resistance
- Pattern labelling: marking engulfing candles, hammers, double tops and double bottoms
- Consistency: applying one standard across dozens of charts without fatigue or the misses that come with it
- Explanation: putting into words why a level matters, which is genuinely useful for learning and review
What it cannot do
One: it cannot forecast. A chart contains no information about the future. Anything framed as "reading the chart to predict price" is pattern-finding in historical data, and whether that pattern holds out of sample requires independent testing.
Two: it does not handle causation. It sees shape, not why — not the rate path, not central bank language, not positioning. Those are precisely what move currencies.
Three: it over-reads. Ask it to find patterns and it will always find some, even on a chart where nothing is there. That is a structural tendency of generative models: when asked for a conclusion, they produce one.
A research result worth knowing
A 2025 study in Nature's Humanities and Social Sciences Communications tested multimodal models on forecasting financial chart movements. The finding: apparent predictive ability was substantially overstated, and the edge shrank sharply once out-of-sample testing was properly controlled.
That does not make AI chart reading useless. It locates the value: reading and annotating, not predicting. Conflating the two is where most misuse begins.
Three common misuses
Misuse one: treating the output as a signal. "The AI says it goes up" carries the same evidential weight as "I think it goes up" — neither substitutes for out-of-sample testing.
Misuse two: substituting a screenshot for data. A screenshot discards precise prices, timestamps and volume. The same shape can sit in completely different volatility regimes.
Misuse three: asking what to do instead of why. The productive question is explanatory — "why is this level resistance?" — not directional — "long or short right now?"
The right workflow: AI first pass, human second pass
- AI annotates: have it list key levels, patterns and trend structure
- Human reviews: check each label against your own rules — right timeframe? right location?
- Write to the plan: only reviewed conclusions enter the trading plan; raw AI output never enters the decision
- Record: log what the AI said against what price did, and build your own error statistics
Prompting: three elements that change the output
The same chart produces very different answers depending on how you ask. A useful prompt has three elements:
One: state the timeframe and instrument. "This is a four-hour EUR/USD chart" is far better than a bare image — otherwise the model infers the timeframe from the axes, and a wrong inference distorts everything downstream.
Two: constrain the task. Say "describe the structure only: trend direction, range boundaries, the nearest key levels" rather than "what happens next". The more specific the task, the more checkable the output.
Three: demand the evidence. "For each conclusion, say which candles you based it on" — this sharply reduces fabrication, because the model has to point at something on the chart.
The worst prompt is "analyse this chart". It reliably produces something that reads comprehensively and cannot be verified.
Testing whether its labels are any good
Do not judge by feel. Run a simple comparison: pick 30 historical charts that have already played out, have the AI label key levels and patterns, then label them yourself against the same standard. Record three things:
- Of the levels it marked, how many you agree with (precision)
- Of the levels you consider key, how many it missed (recall)
- Of its pattern calls, how many were over-reads (false-positive rate)
After 30 charts you have a set of numbers of your own. If precision sits near 70% and the false-positive rate is above 30%, use it only as a rough first pass and never let it reach the decision.
The real value of the exercise is not grading the AI — it is forcing yourself to write your criteria down. Many people finish it and discover they never had a definition of "key level".
Three uses you can adopt immediately
Use one: ten minutes before the session. Drop three daily charts in and ask for trend direction plus the two nearest levels above and below. Review, then write it into the day's plan. Faster than starting from a blank chart.
Use two: reviewing your own screenshots. Feed it a week of your trade screenshots and ask what the entries have in common. Treat the pattern it describes as a hypothesis, then verify it against your data.
Use three: learning a pattern. Have it locate every plausible engulfing on one chart and explain why each qualifies. Closer to real charts than textbook illustrations.
What all three share: AI sees, you judge. The moment it crosses into judgement, its value turns into noise.
FAQ
Can AI replace review? It can replace the marking-up step, not the judging step. Review is about finding your own execution gaps, which requires your rules as the benchmark.
Can it analyse several timeframes at once? Yes, but give it one timeframe at a time and combine the results yourself. Hand it several charts at once and it confuses the timeframes.
Where is it most accurate? Liquid, structurally clean instruments — EUR/USD, USD/JPY, gold — where labels are more reliable. Crosses and minor pairs carry more noise.