How the forex market works
From currency pairs and quoting conventions to liquidity and counterparties, the first layer of understanding.
 Pocket Forex

Losing streaks are inevitable in trading. This article provides a decision sequence for distinguishing a normal drawdown from a strategy that has stopped working, and explains the different responses each requires.

Brent crude closed at 106.06 dollars on 14 October, roughly 70% higher year on year. High oil prices affect not only the direction of commodity currencies but also the cost structure of trading energy instruments.

With Brent crude above 106 dollars and gold swinging by a hundred dollars in a session, trading costs have risen. This article explains why advertised minimum spreads mislead when volatility expands, and which three metrics to compare instead.

The Bank of Japan announces on 30 October and is widely expected to hold while keeping December open, while the Fed is priced to wait in October and act in December. This article explains how to arrange position size and stops around a rate decision.

The first move after CPI, PPI or payrolls usually coincides with the worst execution conditions of the day. This article quantifies how wider spreads and slippage affect expected returns.
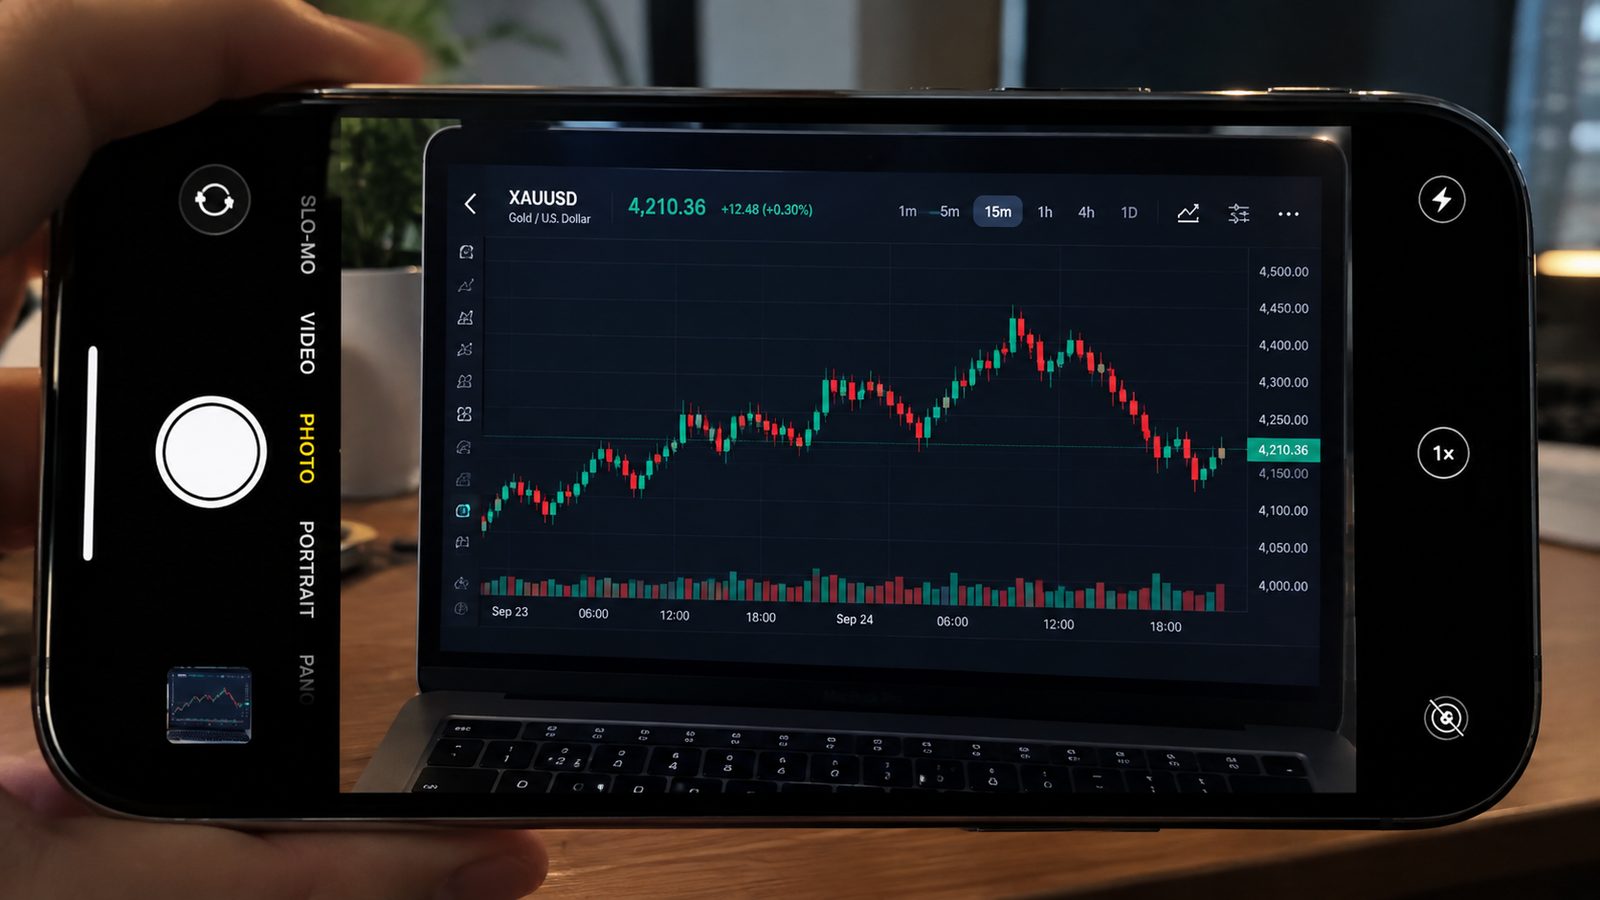
While the dollar strengthens, the correlations between gold, oil and the commodity currencies change. This article explains how to identify a correlation shift and what adjustments to make at portfolio level.
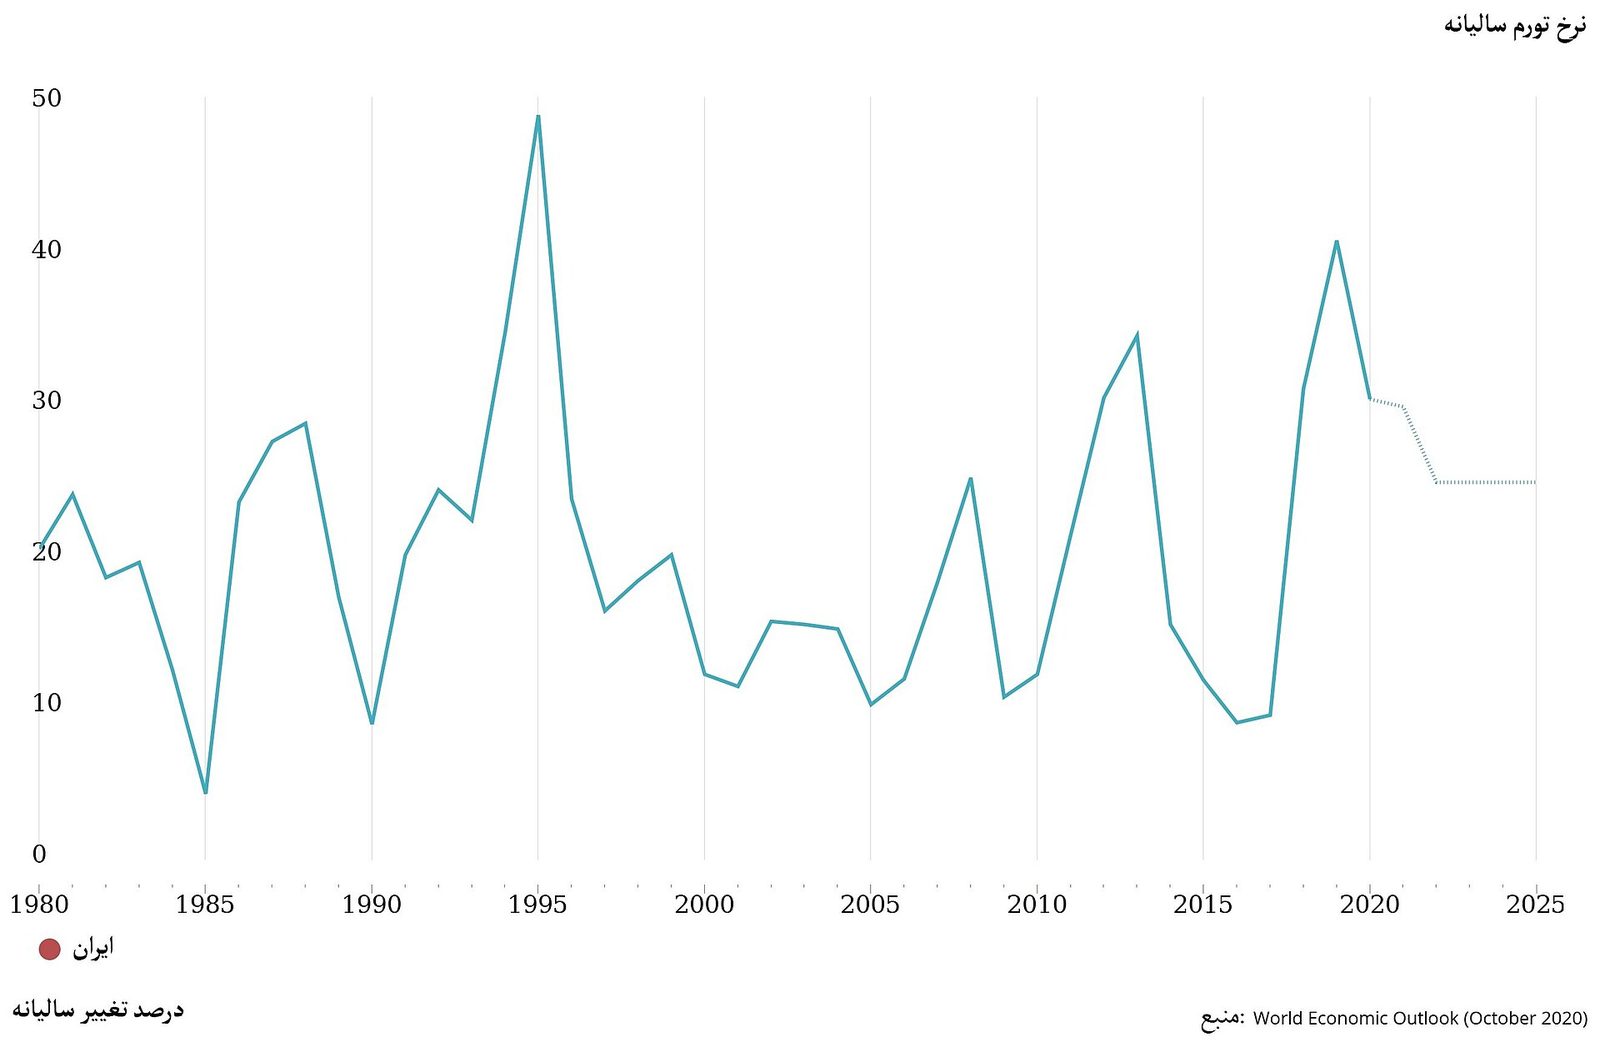
US September CPI rose to 3.7% year on year with a 0.6% monthly print, the largest in five months, and core rose 0.3% on the month. Following the chain from energy to core to expectations to policy to the exchange rate, this article traces how renewed inflation reaches the currency market.

US September CPI came in at 3.7%, above expectations, while payrolls added only 29,000, far below forecast. This article explains how to establish the real weight of policy and the exchange rate when two key releases point in opposite directions.
The dollar index has reached an 18-month high on the combined effect of a rate advantage and positioning structure. This article explains how to use front-end yields and positioning data to judge how long dollar strength can last.
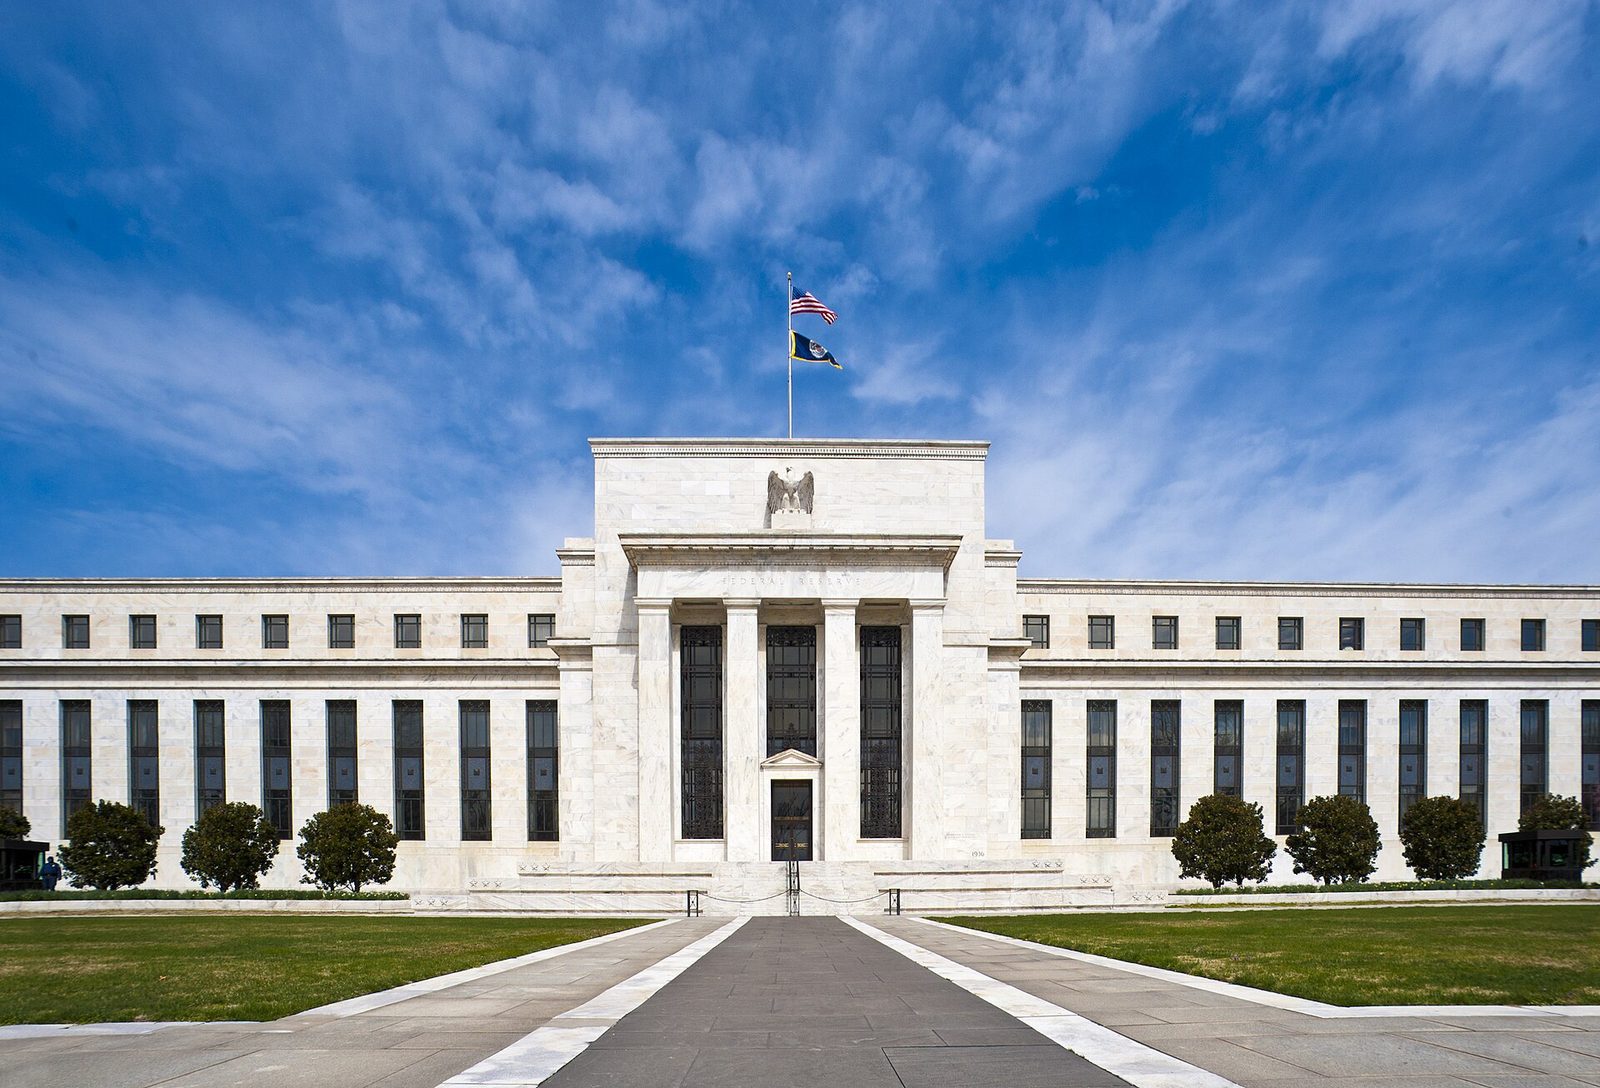
US September CPI rose to 3.7% year on year with a 0.6% monthly print, the largest in five months, forcing markets to reprice the Fed's rate path. This article breaks the dollar's direction into three observable variables: the composition of inflation, front-end Treasury yields and positioning.

The dollar index closed at 102.53 on 14 October, an 18-month high. This article compares how the euro, sterling, the yen and the Australian dollar responded to the same driver, and explains why a broadly stronger dollar produces very different declines across pairs.

After the dollar index hit an 18-month high, EUR/USD has slipped back towards 1.1150. Using 1.1150 and 1.1250 as the axis, this article sets out the directional meaning of a break, the confirmation conditions and the invalidation signals.
From currency pairs and quoting conventions to liquidity and counterparties, the first layer of understanding.
Convert price movement into a definite amount of money before you place the order.
Understand why leverage is not a source of return, and how it amplifies account swings.
Master how the common orders trigger and when to use each.
Understand how volatility and spreads differ between sessions.
Read the market's reaction through rates, inflation and employment.
Decide on the environment first, then choose the method that fits it.
Define risk per trade, total exposure and stopping conditions.
Record the plan, the execution, the result and the next improvement.