
Popular articles

Gold between 4,100 and 4,200: real yields versus safe-haven demand
Spot gold slipped back towards 4,150 dollars in mid-October and briefly lost 4,100 intraday. This article weighs the relative strength of rising real yields against geopolitical hedging demand, and the indicators to track.

When volatility rises, how should grid parameters change?
With oil above 100 dollars and precious metal ranges widening, a grid strategy's band width and step spacing need recalibrating. This article gives three quantifiable adjustment criteria.

Invalidation conditions in a trading plan: this dollar rebound as a case study
The most commonly omitted part of a trading plan is the answer to what would make the view no longer valid. Using this dollar rebound as a case study, this article shows how to write invalidation as executable price, time and signal conditions.

Payrolls at 29k versus a 90k forecast: what the market is really pricing
US September non-farm payrolls added only 29,000 against a 90,000 forecast, and the unemployment rate rose to 4.2%. This article explains why the market held on to its hike expectations after the release, and how to read a divergence between data and pricing.
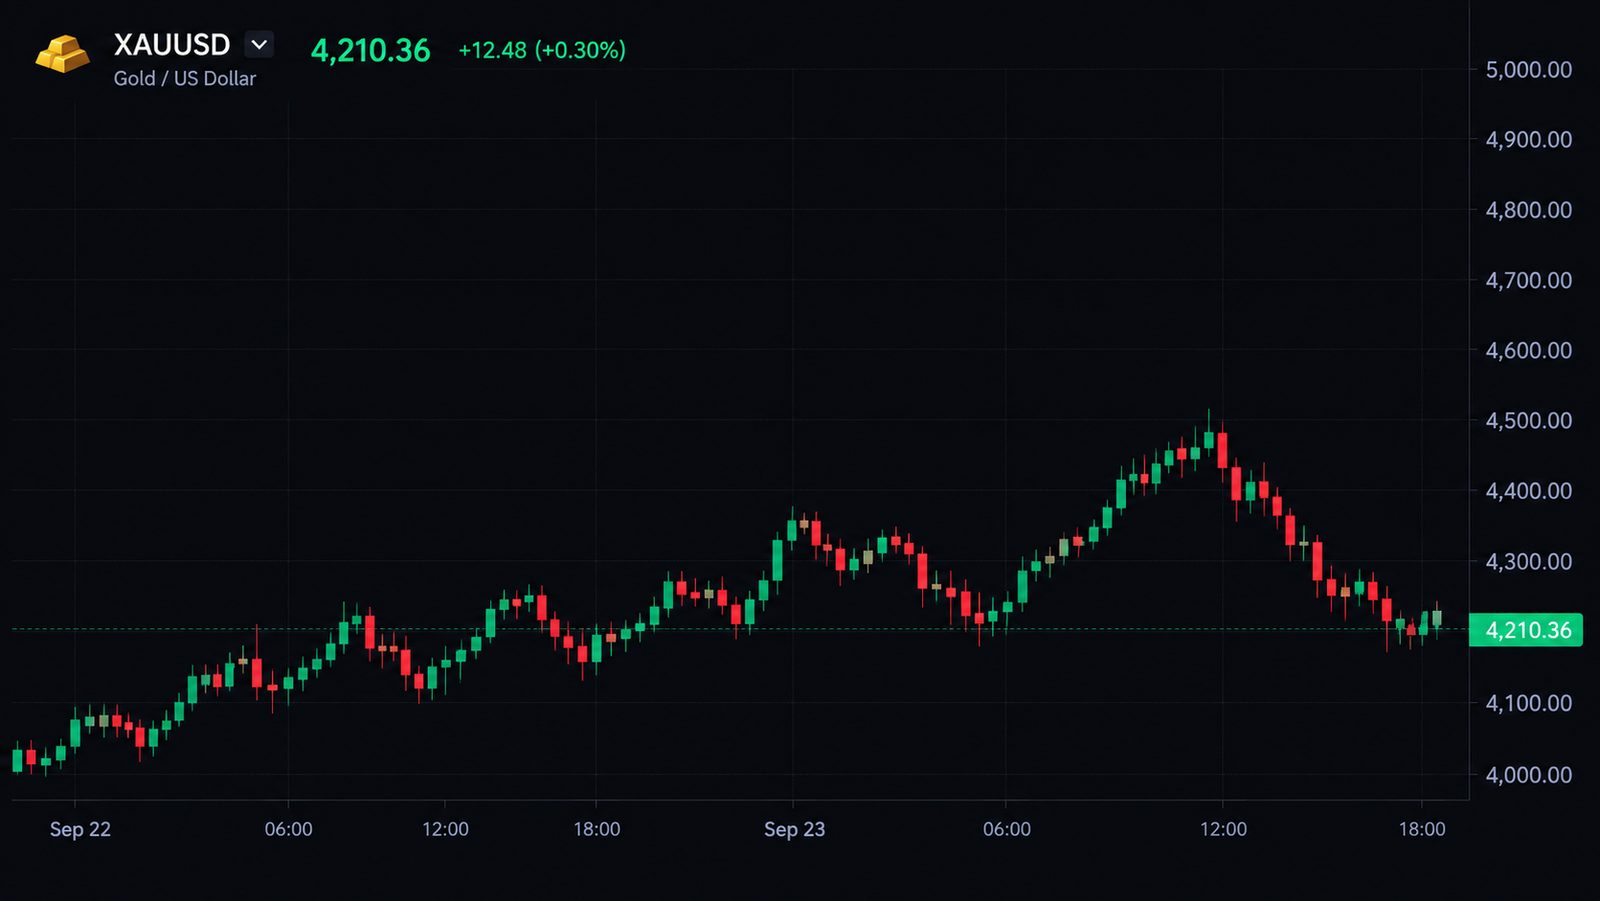
Real and false breakouts: the dollar index and gold after CPI
After US CPI beat expectations on 15 October, the dollar index spiked and gold lost 4,100 before rebounding quickly. These two cases show how to tell a genuine breakout from a brief spike.
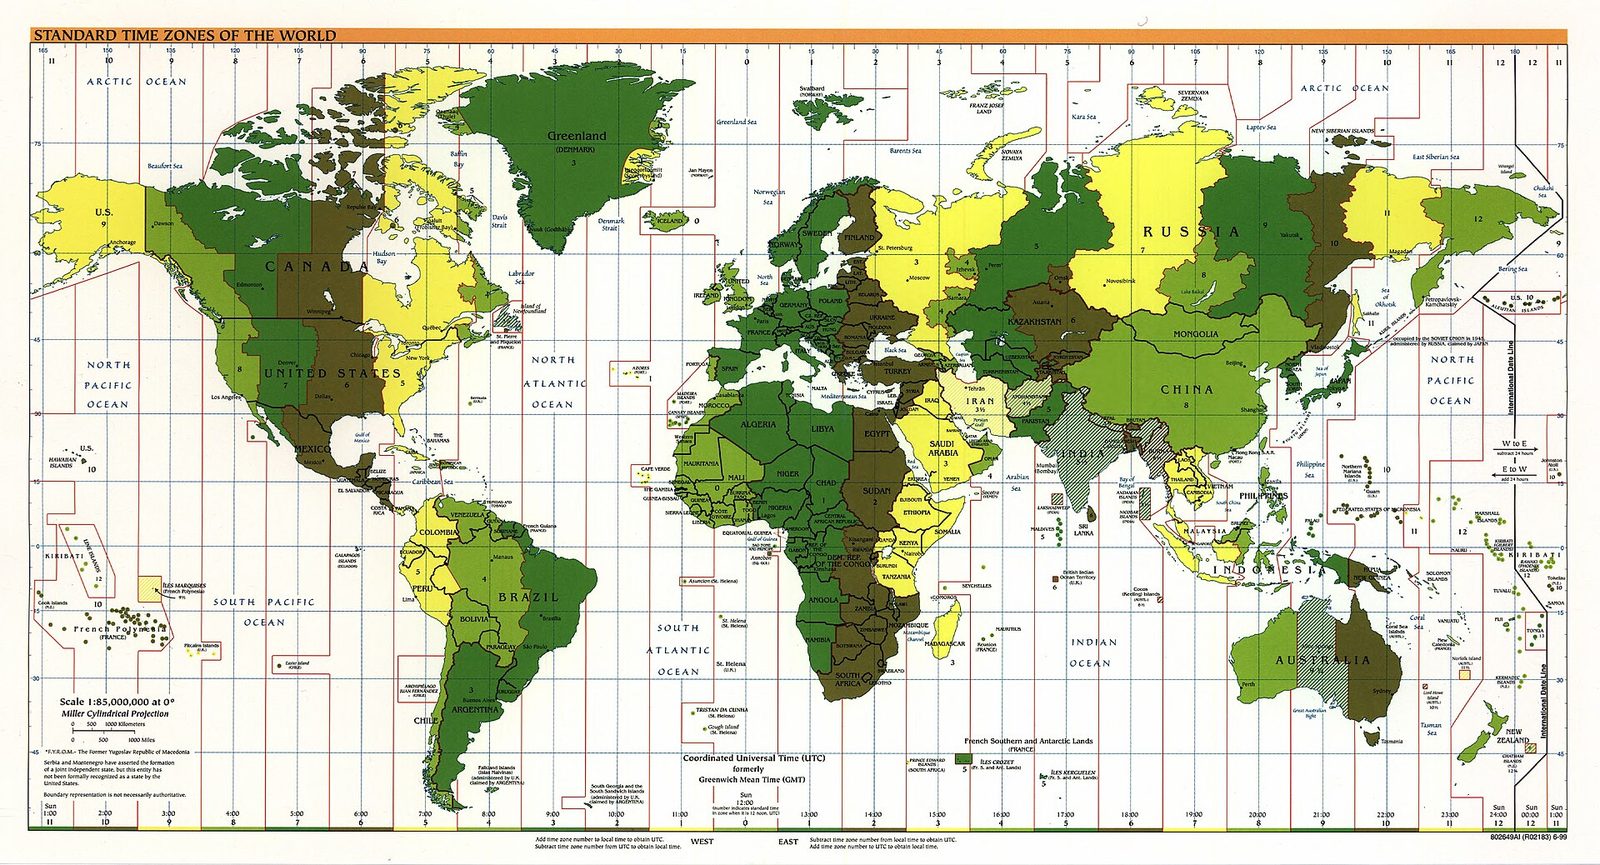
Liquidity across the Asian, European and New York sessions
Spreads, quote depth and slippage differ markedly across sessions for the same pair. Using Beijing time as the reference, this article describes the three sessions and how to adjust order placement around data releases.

Placing stops in a high-volatility market: an ATR approach
With Brent above 100 dollars and gold ranges widening into the hundreds, a stop distance set in a low-volatility regime is easily taken out by noise. This article sets out an ATR-based method for placing stops.

USD/JPY at the 159 line: the technical structure before the BoJ meeting
USD/JPY has been oscillating between 157.60 and 159.00, with the Bank of Japan's 30 October meeting the key variable. This article sets out the boundaries of that range, the confirmation conditions for a break and the invalidation signals.